IBISWorld Platform
Answer any industry question in minutes with our entire database at your fingertips.

The French fertiliser market has undergone a turbulent period thanks to volatile input prices and stiff international competition. A steep rise in natural gas prices, exacerbated by geopolitical tensions following Russia's invasion of Ukraine, has caused dramatic shifts in production expenses for fertiliser manufacturers. The sharp escalation in natural gas costs, a crucial input in ammonia synthesis, propelled fertiliser prices to unprecedented heights in 2022, boosting manufacturers’ revenue and profitability. However, as natural gas prices stabilised, the cost advantage diminished, creating a profit downturn in 2023, despite high fertiliser prices keeping revenue somewhat elevated. Competition intensified as imports from Russia and China flooded the market, supported by their better lower gas prices and ability to offer competitive pricing despite logistical costs.

Answer any industry question in minutes with our entire database at your fingertips.

Feed trusted, human-driven industry intelligence straight into your platform.

Streamline your workflow with IBISWorld’s intelligence built into your toolkit.
IBISWorld's research coverage on the Fertiliser & Nitrogen Compound Manufacturing industry in France includes market sizing, forecasting, data and analysis from 2015-2030. The most recent publication was released March 2025.
The Fertiliser & Nitrogen Compound Manufacturing industry in France operates under the industry code FR-C2012. This industry covers companies that manufacture fertilisers. It also includes companies that manufacture associated nitrogen products; potting soil; and potting soil mixtures comprising natural soil, sand, clays and minerals. Related terms covered in the Fertiliser & Nitrogen Compound Manufacturing industry in France include ammonia, feedstock and compound fertiliser.
Products and services covered in Fertiliser & Nitrogen Compound Manufacturing industry in France include Nitrogen, Potassium and Sulphur.
Companies covered in the Fertiliser & Nitrogen Compound Manufacturing industry in France include Yara France SAS, Groupe Roullier and Fertiberia Sarl.
The Performance chapter covers detailed analysis, datasets, detailed current performance, sources of volatility and an outlook with forecasts for the Fertiliser & Nitrogen Compound Manufacturing industry in France.
Questions answered in this chapter include what's driving current industry performance, what influences industry volatility, how do successful businesses overcome volatility, what's driving the industry outlook. This analysis is supported with data and statistics on industry revenues, costs, profits, businesses and employees.
The Products and Markets chapter covers detailed product and service segmentation, analysis of major markets and international trade data for the for the Fertiliser & Nitrogen Compound Manufacturing industry in France.
Questions answered in this chapter include how are the industry's products and services performing, what are innovations in industry products and services, what products or services do successful businesses offer and what's influencing demand from the industry's markets. This includes data and statistics on industry revenues by product and service segmentation and major markets.
The Geographic Breakdown chapter covers detailed analysis and datasets on regional performance of the Fertiliser & Nitrogen Compound Manufacturing industry in France.
Questions answered in this chapter include where are industry businesses located and how do businesses use location to their advantage. This includes data and statistics on industry revenues by location.
The Competitive Forces chapter covers the concentration, barriers to entry and supplier and buyer profiles in the Fertiliser & Nitrogen Compound Manufacturing industry in France. This includes data and statistics on industry market share concentration, barriers to entry, substitute products and buyer & supplier power.
Questions answered in this chapter include what impacts the industry's market share concentration, how do successful businesses handle concentration, what challenges do potential industry entrants face, how can potential entrants overcome barriers to entry, what are substitutes for industry services, how do successful businesses compete with substitutes and what power do buyers and suppliers have over the industry and how do successful businesses manage buyer & supplier power.
The Companies chapter covers Key Takeaways, Market Share and Companies in the Fertiliser & Nitrogen Compound Manufacturing industry in France. This includes data and analysis on companies operating in the industry that hold a market share greater than 5%.
Questions answered in this chapter include what companies have a meaningful market share and how each company is performing.
The External Environment chapter covers Key Takeaways, External Drivers, Regulation & Policy and Assistance in the Fertiliser & Nitrogen Compound Manufacturing industry in France. This includes data and statistics on factors impacting industry revenue such as economic indicators, regulation, policy and assistance programs.
Questions answered in this chapter include what demographic and macroeconomic factors impact the industry, what regulations impact the industry, what assistance is available to this industry.
The Financial Benchmarks chapter covers Key Takeaways, Cost Structure, Financial Ratios, Valuation Multiples and Key Ratios in the Fertiliser & Nitrogen Compound Manufacturing industry in France. This includes financial data and statistics on industry performance including key cost inputs, profitability, key financial ratios and enterprise value multiples.
Questions answered in this chapter include what trends impact industry costs and how financial ratios have changed overtime.
The Industry Data chapter includes 10 years of historical data with 5 years of forecast data covering statistics like revenue, industry value add, establishments, enterprises, employment and wages in the Fertiliser & Nitrogen Compound Manufacturing industry in France.
More than 6,000 businesses use IBISWorld to shape local and global economies
We were able to supplement our reports with IBISWorld’s information from both a qualitative and quantitative standpoint. All of our reporting now features some level of IBISWorld integration.

IBISWorld delivers the crisp business knowledge we need to drive our business. Whether it be serving up our major clients, winning new business or educating on industry issues, IBISWorld brings real value.

IBISWorld has revolutionised business information — which has proved commercially invaluable to exporters, investors and public policy professionals in Australia and overseas.

When you’re able to speak to clients and be knowledgeable about what they do and the state that they operate in, they’re going to trust you a lot more.

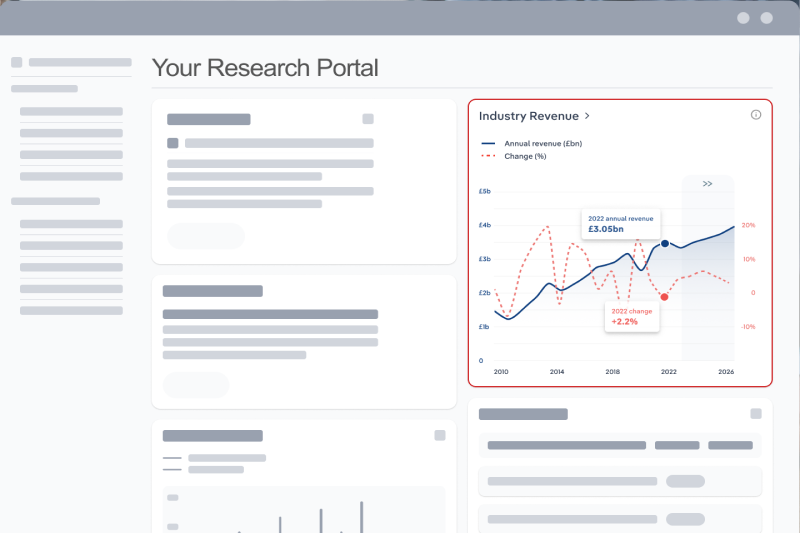
The market size of the Fertiliser & Nitrogen Compound Manufacturing industry in France is €3.1bn in 2026.
There are 97 businesses in the Fertiliser & Nitrogen Compound Manufacturing industry in France, which has declined at a CAGR of 0.2 % between 2020 and 2025.
The market size of the Fertiliser & Nitrogen Compound Manufacturing industry in France has been growing at a CAGR of 0.7 % between 2020 and 2025.
Over the next five years, the Fertiliser & Nitrogen Compound Manufacturing industry in France is expected to grow.
The biggest companies operating in the Fertiliser & Nitrogen Compound Manufacturing industry in France are Yara France SAS, Groupe Roullier and Fertiberia Sarl
Nitrogen and Potassium are part of the Fertiliser & Nitrogen Compound Manufacturing industry in France.
The company holding the most market share in the Fertiliser & Nitrogen Compound Manufacturing industry in France is Yara France SAS.
The level of competition is moderate and increasing in the Fertiliser & Nitrogen Compound Manufacturing industry in France.


