
Industry Statistics and Trends
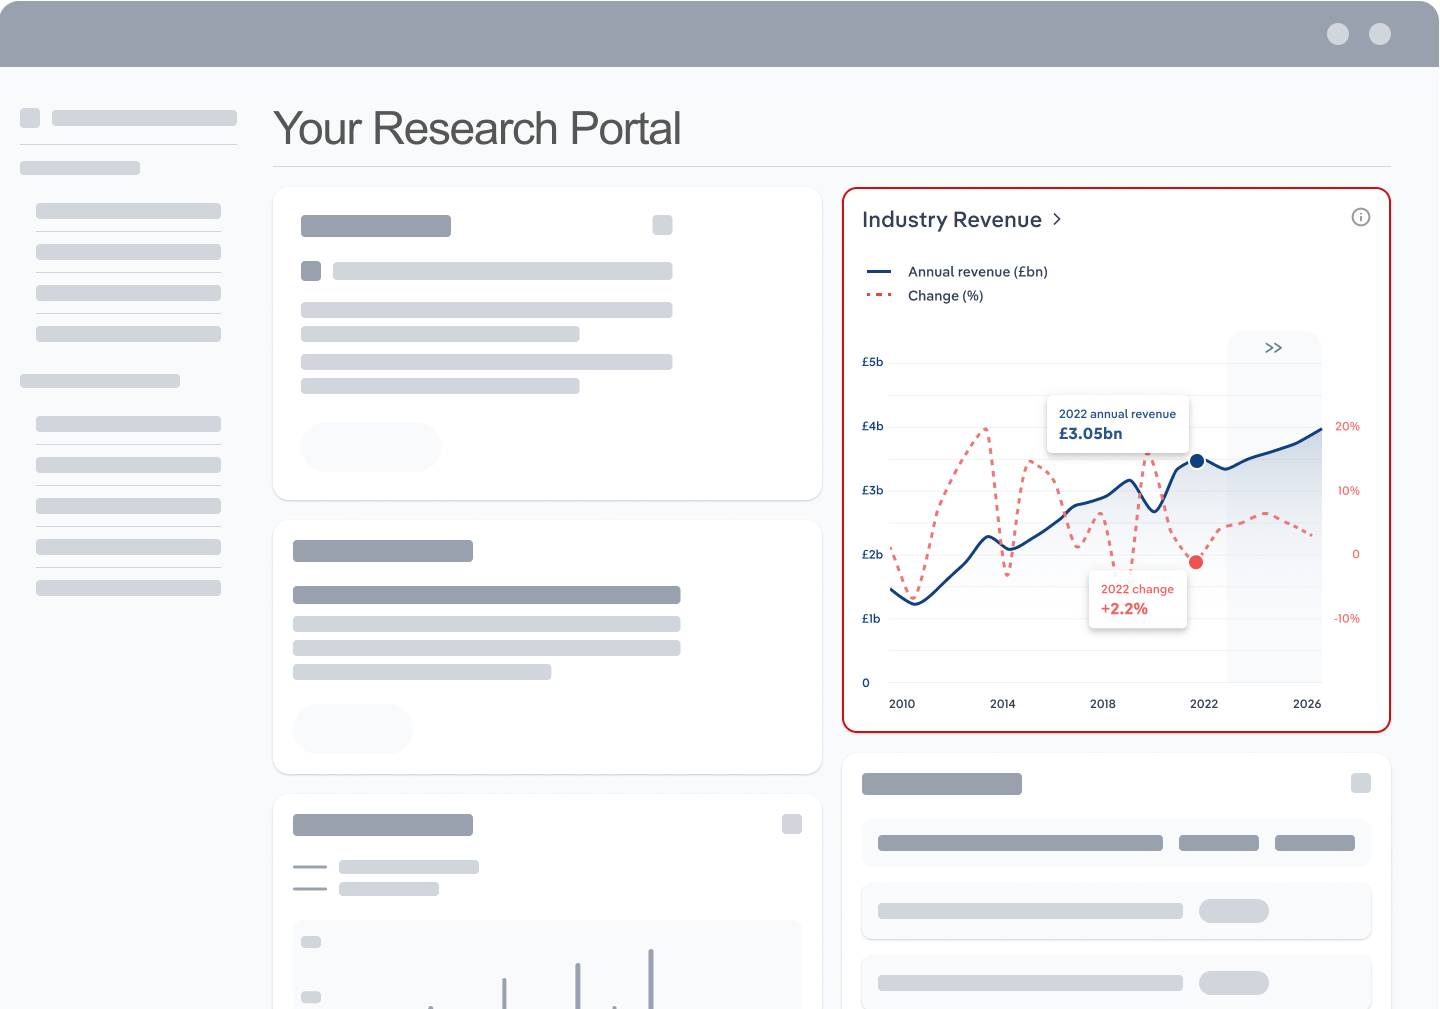
Market size and recent performance (2015-2030)
Industry revenue has grown at a CAGR of 3.8 % over the past five years, to reach an estimated £1.7bn in 2025.
Trends and Insights
Revenue dips following artificially high demand for UK gas exports
- Following Russia’s invasion of Ukraine in 2022, Europe diversified away from Russian liquefied natural gas (LNG), triggering a sharp rise in UK gas exports to the continent. According to the Department for Energy Security and Net Zero, UK natural gas exports tripled in 2022. Increased throughput translates to higher revenue for pipeline operators, as they earn revenue based on the volume of gas transported. Gas export volumes have since declined as European countries have diversified their energy supply chains, reducing reliance on UK gas. In February 2025, the Institute for Energy Economics and Financial Analysis reported that Europe’s imports of LNG fell by 19% in 2024, reaching their lowest level since 2021. This reflects a broader decline in European gas demand and a diminishing role for the UK as a transit hub for gas exports, denting pipeline operators’ prospects. In response, these companies are prioritising operational efficiency. For example, National Gas Transmission (NGT) has streamlined its maintenance schedules and adopted digital monitoring technologies to reduce costs and protect profitability amid a challenging revenue environment.
- Additional trends and insights available with purchase
Industry outlook (2025-2030)
Market size is projected to decline over the next five years.
Trends and Insights
Renewables will continue to draw demand away from natural gas
- The government’s ambitious target to be net zero by 2050 will continue to drive the shift away from natural gas to renewable energy. One example of government policy affecting energy generation is the Clean Power 2030 Action Plan, which aims for 95% of electricity generation to come from clean sources by 2030. As consumers and power generators transition to low-carbon alternatives, demand for natural gas will inch down, reducing pipeline throughput and placing continued pressure on pipeline operators’ revenue.
Biggest companies in the Pipeline Transport in the UK
| Company | Market Share (%)
2026 | Revenue (£m)
2026 |
|---|---|---|
National Gas Transmission plc | 1,408.0 | |
Exolum Pipeline System Ltd | 94.0 | |
GNI (UK) Ltd | 63.0 |
To view the market share and analysis for all 5 top companies in this industry, view purchase options.
Products & Services Segmentation
Industry revenue is measured across several distinct product and services lines, including Natural gas, Petroleum and Water and other liquids. Natural gas is the largest segment of the Pipeline Transport in the UK.
Trends and Insights
Revenue from natural gas slows following an artificial boom
- Natural gas is by far the largest product transported by the Pipeline Transport industry. The National Transmission System (NTS) comprises nearly 8,000 km of high-pressure pipelines connecting nine onshore processing terminals, import terminals and one offshore terminal in the North Sea. This extensive network allows for the efficient transportation of natural gas from production sites and import points to distribution networks across the country.
- More insights available in the full report
Table of Contents
About this industry
Industry definition
Pipeline transport companies transport gases, liquids, water, slurry and other commodities by pipeline. The industry covers long-distance connections between countries or distribution grids, rather than local supply facilities. Businesses also operate pump stations.
What's included in this industry?
Products and services covered in the Pipeline Transport industry in the United Kingdom include Natural gas, Petroleum and Water and other liquids.Companies
Companies covered in the Pipeline Transport industry in the United Kingdom include National Gas Transmission plc, Exolum Pipeline System Ltd and GNI (UK) Ltd.Purchase this report to view all 5 major companies in this industry.
Related Terms
Related terms covered in the Pipeline Transport industry in the United Kingdom include slurry, gas transmission system, liquefied natural gas (lng) and shrinkage costs.Industry Code
SIC 49.50 - Pipeline Transport in the UK
Performance
Get an indication of the industry's health through historical, current and forward-looking trends in the performance indicators that make or break businesses.
Analyst insights
The sustainability shift reduces demand for natural gas. As households and businesses transition to renewable alternatives, gas throughput declines, placing downward pressure...
In this chapter (4)
- Current Performance
- Outlook
- Volatility
- Life Cycle
Key metrics
- Annual Revenue, Recent Growth, Forecast, Revenue Volatility
- Number of Employees, Recent Growth, Forecast, Employees per Business, Revenue per Employee
- Number of Businesses, Recent Growth, Forecast, Employees per Business, Revenue per Business
- Total Profit, Profit Margin, Profit per Business
Charts
- Revenue, including historical (2015-2024) and forecast (2025-2030)
- Employees, including historical (2015-2024) and forecast (2025-2030)
- Businesses, including historical (2015-2024) and forecast (2025-2030)
- Profit, including historical (2015-2025)
- Industry Volatility vs. Revenue Growth
- Industry Life Cycle
Detailed analysis
- Trends in supply, demand and current events that are driving current industry performance
- Expected trends, economic factors and ongoing events that drive the industry's outlook
- Key success factors for businesses to overcome volatility
- How contribution to GDP, industry saturation, innovation, consolidation, and technology and systems influence the industry's life cycle phase.
Products and Markets
Learn about an industry's products and services, markets and trends in international trade.
Analyst insight
High natural gas prices curtail demand for pipeline transport. High gas prices have led to a reduction in pipeline transport volumes, as businesses and consumers alike have s...
In this chapter
- Products & Services
- Major Markets
Key metrics
- Largest market segment and value in 2025
- Product innovation level
Charts
- Products & services segmentation in 2025
- Major market segmentation in 2025
Detailed analysis
- Trends impacting the recent performance of the industry's various segments
- Innovations in the industry's product or service offering, specialization or delivery method
- Key factors that successful businesses consider in their offerings
- Buying segments and key trends influencing demand for industry products and services
Geographic Breakdown
Discover where business activity is most concentrated in an industry and the factors driving these trends to find opportunities and conduct regional benchmarking.
Analyst insights
The North East's connection to Norway is a boon. With Norway producing a significant share of Europe's gas, businesses located here have a distinct advantage in terms of easi...
In this chapter (1)
- Business Locations
Charts
- Share of revenue, establishment, wages and employment in each region
- Share of population compared to establishments in each region in 2025
Tables
- Number and share of establishments in each region in 2025
- Number and share of revenue each region accounts for in 2025
- Number and share of wages each region accounts for in 2025
- Number and share of employees in each region in 2025
Detailed analysis
- Geographic spread of the industry across Europe, and trends associated with changes in the business landscape
- Key success factors for businesses to use location to their advantage
Competitive Forces
Get data and insights on what's driving competition in an industry and the challenges industry operators and new entrants may face, with analysis built around Porter's Five Forces framework.
Analyst insights
Competition is limited. The need for complex, specialised infrastructure means only a few companies, operating under regulatory bodies, hold significant market share.
In this chapter (4)
- Concentration
- Barriers to Entry
- Substitutes
- Buyer & Supplier Analysis
Key metrics
- Industry concentration level
- Industry competition level and trend
- Barriers to entry level and trend
- Substitutes level and trend
- Buyer power level and trend
- Supplier power level and trend
Charts
- Market share concentration among the top 4 suppliers from 2020-2025
- Supply chain including upstream supplying industries and downstream buying industries, flow chart
Detailed analysis
- Factors impacting the industry’s level of concentration, such as business distribution, new entrants, or merger and acquisition activity.
- Key success factors for businesses to manage the competitive environment of the industry.
- Challenges that potential industry entrants face such as legal, start-up costs, differentiation, labor/capital intensity and capital expenses.
- Key success factors for potential entrants to overcome barriers to entry.
- Competitive threats from potential substitutes for the industry’s own products and services.
- Key success factors for how successful businesses can compete with substitutes.
- Advantages that buyers have to keep favorable purchasing conditions.
- Advantages that suppliers have to maintain favorable selling conditions.
- Key success factors for how businesses can navigate buyer and supplier power.
Companies
Learn about the performance of the top companies in the industry.
Analyst insights
National Gas Transmission dominates through the National Transmission System. The company owns significant infrastructure, including almost 8,000km of high-pressure pipes, an...
In this chapter
- Market Share Concentration
- Companies
- Company Spotlights
Charts
- Industry market share by company in 2021 through 2025
- Major companies in the industry, including market share, revenue, profit and profit margin in 2025
- Overview of National Gas Transmission plc's performance by revenue, market share and profit margin from 2019 through 2025
- Overview of Exolum Pipeline System Ltd 's performance by revenue, market share and profit margin from 2019 through 2025
- Overview of GNI (UK) Ltd's performance by revenue, market share and profit margin from 2019 through 2025
- Overview of revenue, market share and profit margin trend for 2 additional companies
Detailed analysis
- Description and key data for National Gas Transmission plc, and factors influencing its performance in the industry
- Description and key data for Exolum Pipeline System Ltd , and factors influencing its performance in the industry
- Description and key data for GNI (UK) Ltd, and factors influencing its performance in the industry
- Description, key data and performance trends for 2 additional companies
External Environment
Understand the demographic, economic and regulatory factors that shape how businesses in an industry perform.
Analyst insights
Ofgem's RIIO price controls dictate revenue. Ofgem determines the revenue pipeline operators can collect, aiming to ensure fair charges and efficient services.
In this chapter
- External Drivers
- Regulation & Policy
- Assistance
Key metrics
- Regulation & policy level and trend
- Assistance level and trend
Charts
- Regulation & Policy historical data and forecast (2015-2030)
- Assistance historical data and forecast (2015-2030)
Detailed analysis
- Demographic and macroeconomic factors influencing the industry, including Regulation & Policy and Assistance
- Major types of regulations, regulatory bodies, industry standards or specific regulations impacting requirements for industry operators
- Key governmental and non-governmental groups or policies that may provide some relief for industry operators.
Financial Benchmarks
View average costs for industry operators and compare financial data against an industry's financial benchmarks over time.
Analyst insights
High profitability funds the industry's growth. As pipeline transport has a monopoly power and needs hefty capital investment, companies leverage their substantial profit to ...
In this chapter
- Cost Structure
- Financial Ratios
- Key Ratios
Key metrics
- Profit margin, and how it compares to the sector-wide margin
- Average wages, and how it compares to the sector-wide average wage
- Largest cost component as a percentage of revenue
- Industry average ratios for days' receivables, industry coverage and debt-to-net-worth ratio
Charts
- Average industry operating costs as a share of revenue, including purchases, wages, depreciation, utilities, rent, other costs and profit in 2025
- Average sector operating costs as a share of revenue, including purchases, wages, depreciation, utilities, rent, other costs and profit in 2025
- Investment vs. share of economy
Data tables
- Liquidity Ratios (2019-2023)
- Coverage Ratios (2019-2023)
- Leverage Ratios (2019-2023)
- Operating Ratios (2019-2023)
- Assets (2019-2023)
- Liabilities (2019-2023)
- Cash Flow & Debt Service Ratios (2015-2030)
- Revenue per Employee (2015-2030)
- Revenue per Enterprise (2015-2030)
- Employees per Establishment (2015-2030)
- Employees per Enterprise (2015-2030)
- Average Wage (2015-2030)
- Wages/Revenue (2015-2030)
- Establishments per Enterprise (2015-2030)
- IVA/Revenue (2015-2030)
- Imports/Demand (2015-2030)
- Exports/Revenue (2015-2030)
Detailed analysis
- Trends in the cost component for industry operators and their impact on industry costs and profitability
Key Statistics
Industry Data
Data Tables
Including values and annual change:
- Revenue (2015-2030)
- IVA (2015-2030)
- Establishments (2015-2030)
- Enterprises (2015-2030)
- Employment (2015-2030)
- Exports (2015-2030)
- Imports (2015-2030)
- Wages (2015-2030)
Top Questions Answered
Unlock comprehensive answers and precise data upon purchase. View purchase options.
What is the market size of the Pipeline Transport industry in the United Kingdom in 2025?
The market size of the Pipeline Transport industry in the United Kingdom is £1.7bn in 2025.
How many businesses are there in the Pipeline Transport industry in the United Kingdom in 2025?
There are 10 businesses in the Pipeline Transport industry in the United Kingdom, which has declined at a CAGR of 5.1 % between 2020 and 2025.
How may import tariffs affect the Pipeline Transport industry in the United Kingdom?
The Pipeline Transport industry in the United Kingdom is unlikely to be materially impacted by import tariffs with imports accounting for a low share of industry revenue.
How may export tariffs affect the Pipeline Transport industry in the United Kingdom?
The Pipeline Transport industry in the United Kingdom is unlikely to be materially impacted by export tariffs with exports accounting for a low share of industry revenue.
Has the Pipeline Transport industry in the United Kingdom grown or declined over the past 5 years?
The market size of the Pipeline Transport industry in the United Kingdom has been growing at a CAGR of 3.8 % between 2020 and 2025.
What is the forecast growth of the Pipeline Transport industry in the United Kingdom over the next 5 years?
Over the next five years, the Pipeline Transport industry in the United Kingdom is expected to decline.
What are the biggest companies in the Pipeline Transport industry in the United Kingdom?
The biggest companies operating in the Pipeline Transport industry in the United Kingdom are National Gas Transmission plc, Exolum Pipeline System Ltd and GNI (UK) Ltd
What does the Pipeline Transport industry in the United Kingdom include?
Natural gas and Petroleum are part of the Pipeline Transport industry in the United Kingdom.
Which companies have the highest market share in the Pipeline Transport industry in the United Kingdom?
The company holding the most market share in the Pipeline Transport industry in the United Kingdom is National Gas Transmission plc.
How competitive is the Pipeline Transport industry in the United Kingdom?
The level of competition is low and steady in the Pipeline Transport industry in the United Kingdom.
Methodology
How are IBISWorld reports created?
IBISWorld has been a leading provider of trusted industry research for over 50 years to the most successful companies worldwide. With offices in Australia, the United States, the United Kingdom, Germany and China, we are proud to have local teams of analysts that conduct research, data analysis and forecasting to produce data-driven industry reports.
Our analysts start with official, verified and publicly available sources of data to build the most accurate picture of each industry. Analysts then leverage their expertise and knowledge of the local markets to synthesize trends into digestible content for IBISWorld readers. Finally, each report is reviewed by one of IBISWorld’s editors, who provide quality assurance to ensure accuracy and readability.
IBISWorld relies on human-verified data and human-written analysis to compile each standard industry report. We do not use generative AI tools to write insights, although members can choose to leverage AI-based tools within the platform to generate additional analysis formats.
What data sources do IBISWorld analysts use?
Each industry report incorporates data and research from government databases, industry-specific sources, industry contacts, and our own proprietary database of statistics and analysis to provide balanced, independent and accurate insights.
Key data sources in the UK include:
- Office for National Statistics
- Office for Budget Responsibility
- Bank of England
Analysts also use industry specific sources to complement catch-all sources, although their perspective may focus on a particular organization or representative body, rather than a clear overview of all industry operations. However, when balanced against other perspectives, industry-specific sources provide insights into industry trends.
These sources include:
- Industry and trade associations
- Industry federations or regulators
- Major industry players annual or quarterly filings
Finally, IBISWorld’s global data scientists maintain a proprietary database of macroeconomic and demand drivers, which our analysts use to help inform industry data and trends. They also maintain a database of statistics and analysis on thousands of industries, which has been built over our more than 50-year history and offers comprehensive insights into long-term trends.
How does IBISWorld forecast its data?
IBISWorld’s analysts and data scientists use the sources above to create forecasts for our proprietary datasets and industry statistics. Depending on the dataset, they may use regression analysis, multivariate analysis, time-series analysis or exponential smoothing techniques to project future data for the industry or driver. Additionally, analysts will leverage their local knowledge of industry operating and regulatory conditions to impart their best judgment on the forecast model.
IBISWorld prides itself on being a trusted, independent source of data, with over 50 years of experience building and maintaining rich datasets and forecasting tools. We are proud to be the keystone source of industry information for thousands of companies across the world.
Learn more about our methodology and data sourcing on the Help Center.